Marketing & Events
Review website traffic on your public pages
See how many people visit your facility website, which pages they open, and whether traffic is growing—without leaving Marketing & Events.
What you will accomplish
You will open the Website tab in Marketing & Events and understand who is visiting your public facility pages. When Google Analytics is connected, you can see page views, visitors, popular pages, and whether traffic is up or down compared to last month.
This guide is for facility owners and managers who want a simple traffic report—not a full marketing dashboard.
When to use this guide
- You launched a new public facility page and want to know if anyone is finding it.
- You added your registration link to your main website and want to see if clicks increased.
- You are deciding whether to invest more in online ads, open houses, or email campaigns.
- You need a quick answer to "Are more people visiting us online this month?"
Before you start
- Public Facility Pages are turned on in Settings > Website & customer app.
- You can open Marketing & Events from the dashboard sidebar.
- For full traffic charts, you have (or can add) a Google Analytics measurement ID—explained in Step 3 below.
Without Google Analytics: You can still open the Website tab and confirm which public address is being measured. Charts stay empty until you save a valid Google Analytics ID.
With Google Analytics: Visits to your public pages are counted automatically after you paste your measurement ID (it usually starts with G-).
Step 1: Open the Website tab
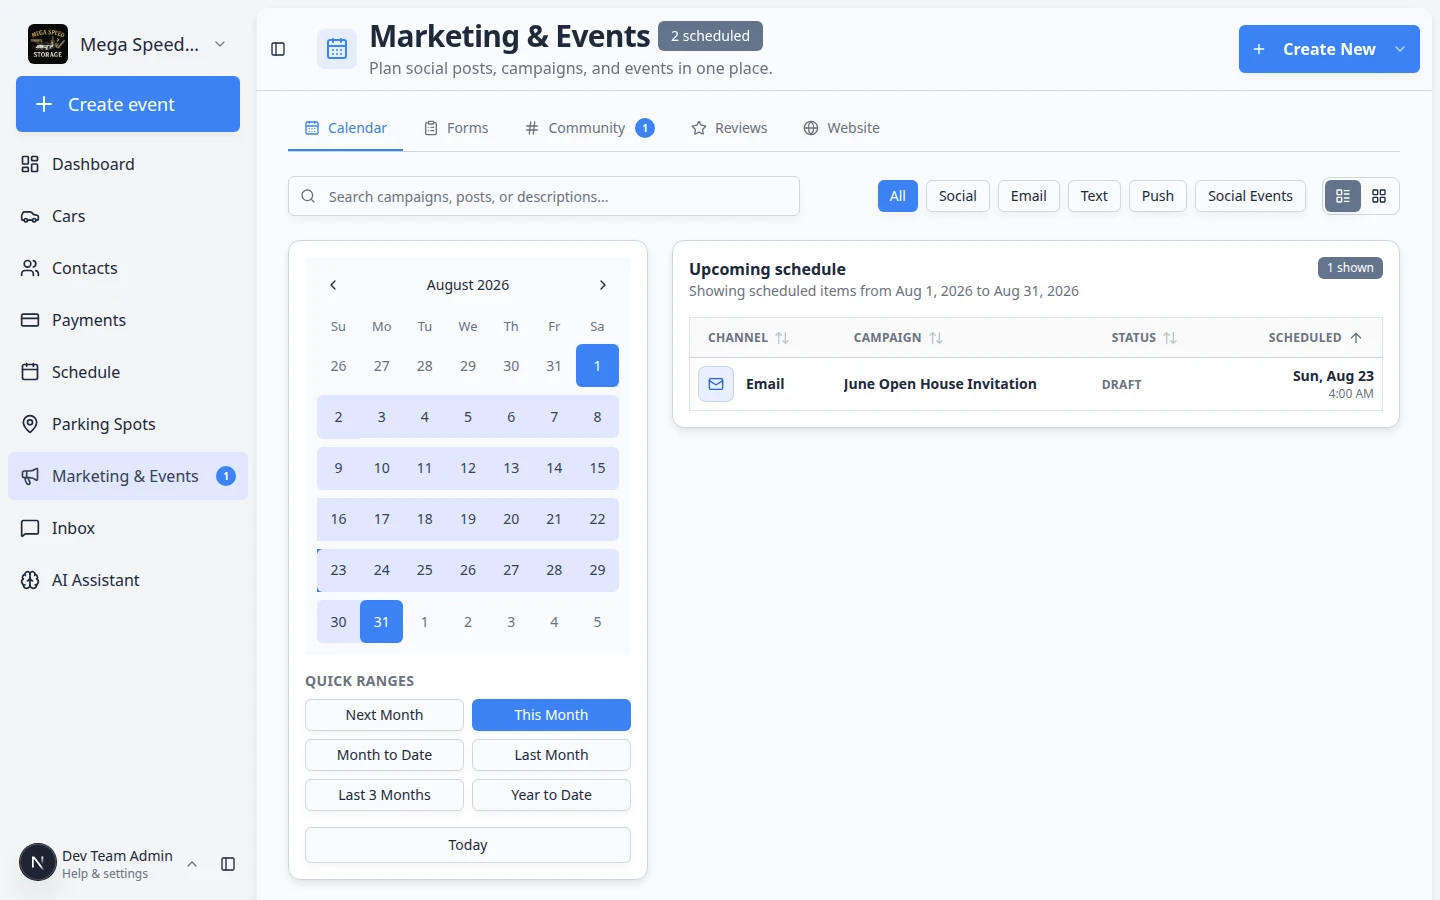
- Open Marketing & Events
From the dashboard sidebar, click Marketing & Events. You can also go directly to Marketing & Events.
Expected result: You see the Calendar tab selected by default.
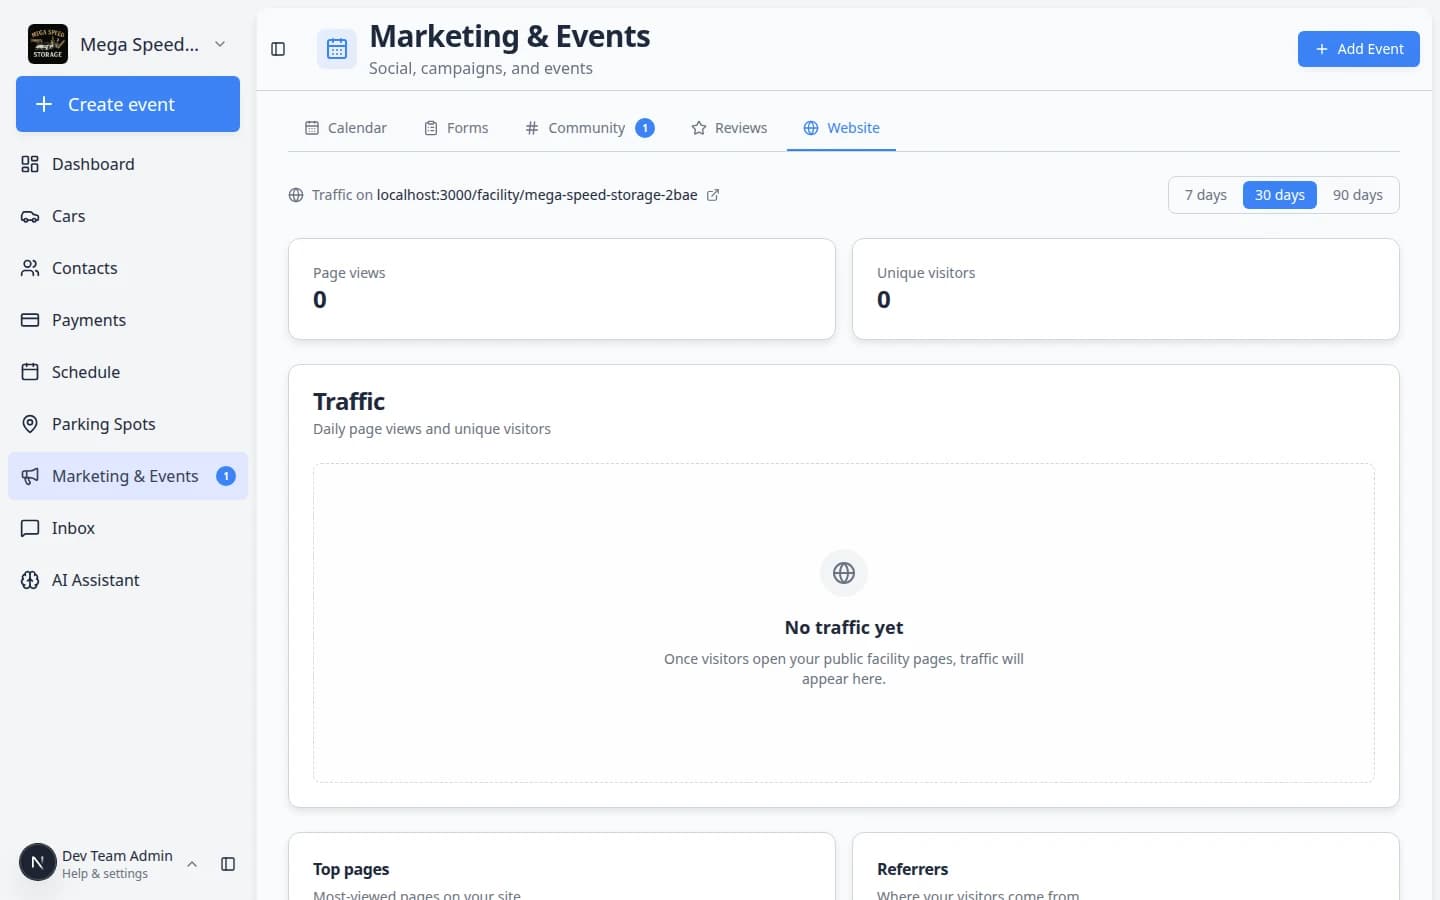
- Click Website
Near the top of the page, click the Website tab—the one with the globe icon. You can also open Marketing & Events > Website directly.
Why this matters: Website traffic is separate from campaigns, forms, community, and reviews. The Website tab keeps traffic in one place.
- Confirm which site is being measured
Under the tabs, read the line that starts with Traffic on. It shows your public facility address (for example
carstoragesoftware.com/facility/your-facility-nameor your custom domain).Expected result: The address matches the link you share with customers—not a
/dashboardstaff link.
Step 2: Read the traffic summary
- Pick a time range
In the top-right area, click 7 days, 30 days, or 90 days.
Why this matters: A busy open-house week looks different from a full quarter. Match the range to the question you are trying to answer.
- Read Page views and Visitors
Page views counts how many times pages were opened (one person can open several pages). Visitors counts unique people.
Under each number, you may see a note such as +12% vs previous period or -5% vs previous period. That compares this range to the same-length period just before it.
Expected result: You can tell whether traffic is growing, flat, or slowing down.
- Review the traffic chart
The line chart shows daily page views and visitors across the range you picked.
Why this matters: Spikes often line up with emails, social posts, or events. A flat line may mean your public link is hard to find.
Step 3: Connect Google Analytics (first-time setup)
Skip this section if charts already show numbers and you only need to read them.
- Get your Google Analytics measurement ID
In your Google Analytics account, find the Measurement ID for your website property. It usually looks like G-XXXXXXXXXX.
If you do not have Google Analytics yet, create a free property for your facility website in Google’s tools, then copy the ID.
Why this matters: Car Storage Software uses this ID to pull visit counts into the Website tab. Without it, charts stay empty even when people visit your pages.
- Paste the ID on the Website tab
On Marketing & Events > Website, scroll to the Google Analytics card. Paste your measurement ID into the box.
Expected result: The ID appears in the field exactly as Google shows it (including the G- prefix).
- Click Save
Click Save on the Google Analytics card.
Expected result: A short confirmation appears. Traffic may take a few hours to show the first time—Google needs time to collect visits.
- Check back after real visits
Open your public facility page in a private browser window once to generate a test visit. Return to the Website tab the next day and click your time range again.
Why this matters: Analytics is not instant. Give it at least a few hours before you worry that setup failed.
Step 4: Use top pages, referrers, and devices
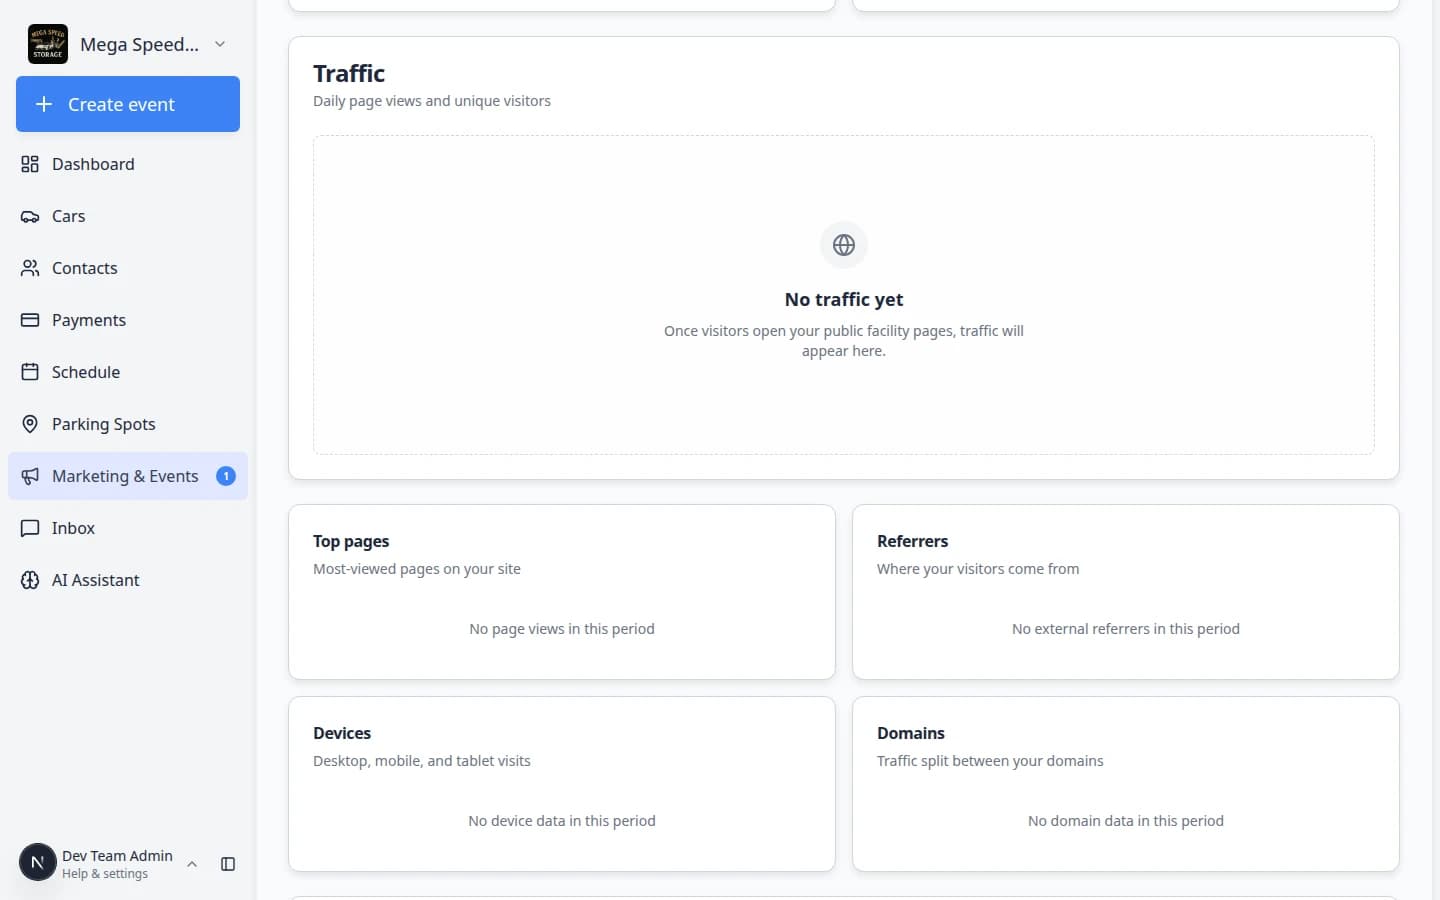
- Open Top pages
Scroll to Top pages. This list shows which public paths customers opened most often (for example your main facility page or registration form).
Why this matters: If registration gets few views but your main page gets many, you may need a clearer button on your website.
- Open Top referrers
Top referrers shows which websites sent people to you (search engines, social networks, your main business site).
Expected result: You learn whether customers find you from Google, Instagram, email links, or direct typing.
- Open Devices
Devices splits traffic into desktop, mobile, and tablet.
Why this matters: If most visits are mobile, preview every public page on a phone before you share it widely. See Go live checklist for public pages.
What success looks like
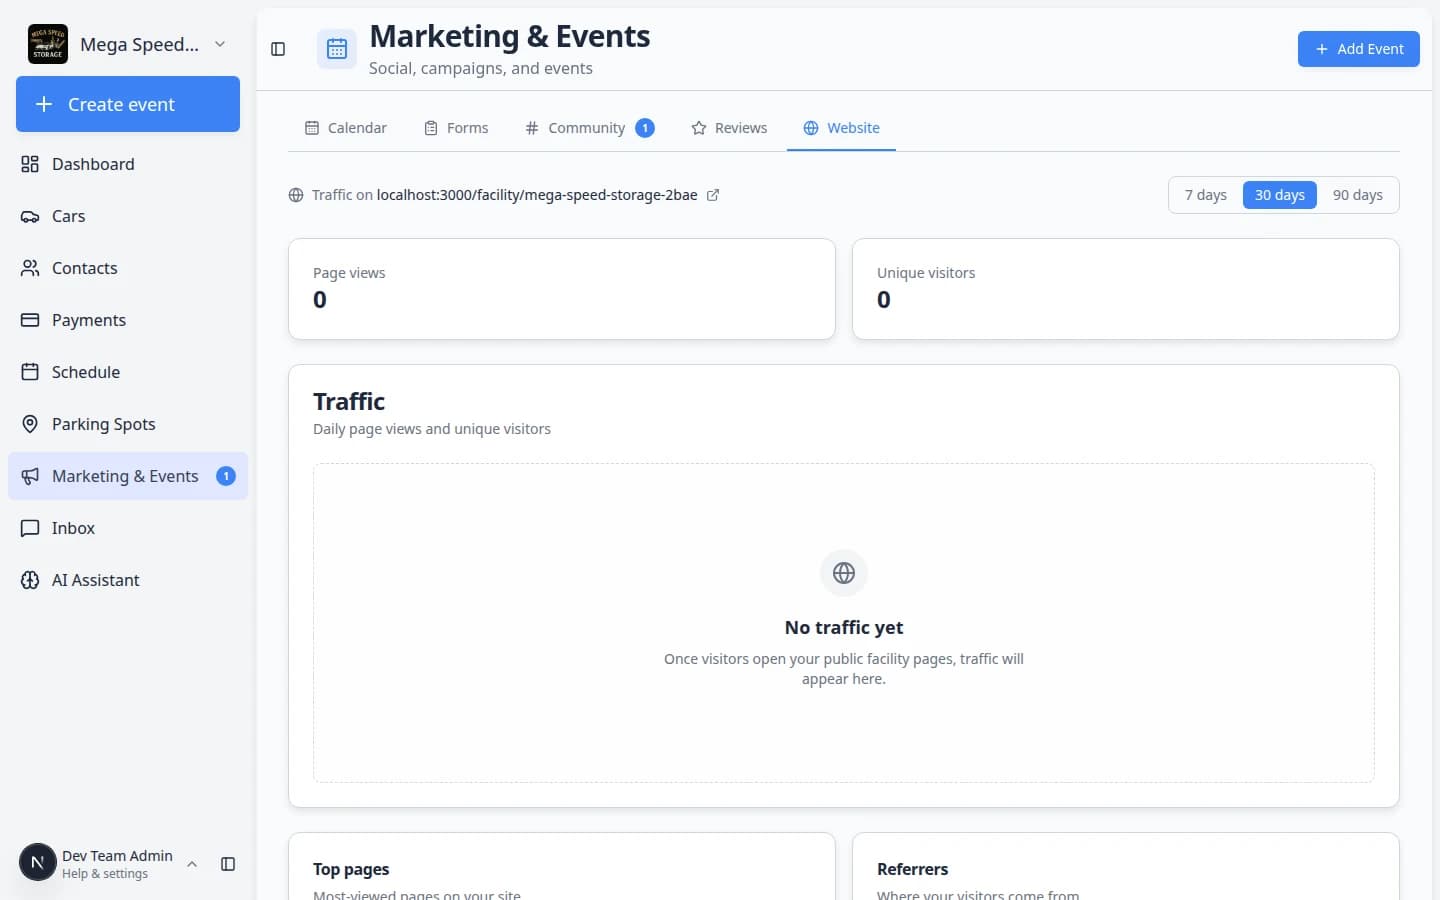
- You can open the Website tab and name the public address being measured.
- Google Analytics is saved (if your facility uses it) and charts show real visit counts.
- You know whether traffic went up or down compared to the previous period.
- You can point to the most-viewed public page and plan improvements there.
Troubleshooting
What to do next
- Go live checklist for public pages — test links before you promote them.
- Create a campaign — email customers when you want to drive more visits to a specific page.
- Embed a custom form on your website — add a survey directly on your public facility page.
- Marketing & Events overview — return to the full list of marketing guides.